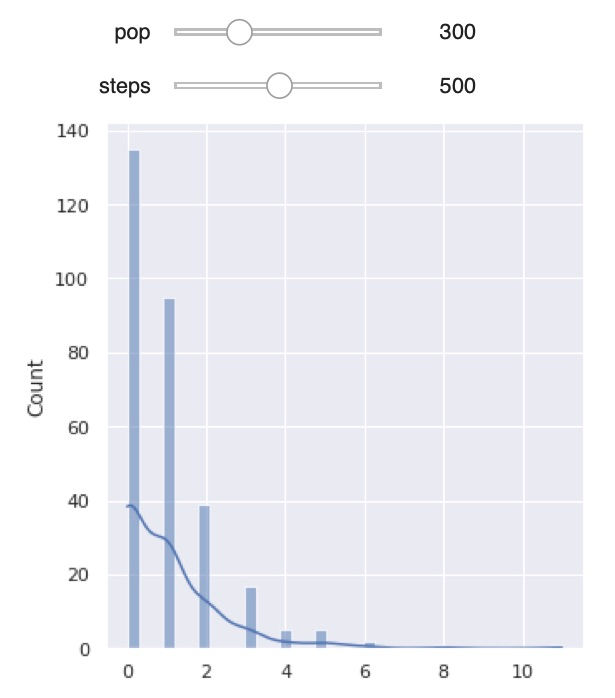
Mesa is a Python framework for agent-based modeling. I created example interactive graph in Python and Mesa.
Dashboard like widget can be used e.g. in html on website. This basic example is providing histogram relationship between population count and steps.
pip install mesa
from mesa import Agent, Model
from mesa.time import RandomActivation
import matplotlib.pyplot as plt
import seaborn as sns
from ipywidgets import interact, interact_manual
import numpy as np
from mesa import Agent, Model
from mesa.space import SingleGrid
from mesa.time import RandomActivation
import matplotlib.pyplot as plt
from ipywidgets import interact, interact_manual, IntSlider
from matplotlib import animation, rc
from IPython.display import HTML
import math
sns.set()
class MoneyAgent(Agent):
""" An agent with fixed initial wealth."""
def __init__(self, unique_id, model):
super().__init__(unique_id, model)
self.wealth = 1
def step(self):
if self.wealth == 0:
return
other_agent = self.random.choice(self.model.schedule.agents)
other_agent.wealth += 1
self.wealth -= 1
class MoneyModel(Model):
"""A model with some number of agents."""
def __init__(self, N):
self.num_agents = N
self.schedule = RandomActivation(self)
# Create agents
for i in range(self.num_agents):
a = MoneyAgent(i, self)
self.schedule.add(a)
def step(self):
'''Advance the model by one step.'''
self.schedule.step()
@interact(pop=(0, 1000, 50), steps=(0, 1000, 50))
def run(pop=500, steps=500):
model = MoneyModel(pop)
for i in range(steps):
model.step()
agent_wealth = [a.wealth for a in model.schedule.agents]
sns.displot(agent_wealth, kde=True)

References:
https://community.plotly.com/t/export-plotly-and-ipywidgets-as-an-html-file/18579/7
https://nordicesmhub.github.io/deep_python/14-publish/index.html
https://coderzcolumn.com/tutorials/python/interactive-widgets-in-jupyter-notebook-using-ipywidgets
https://conference.scipy.org/proceedings/scipy2015/pdfs/jacqueline_kazil.pdf
Comments