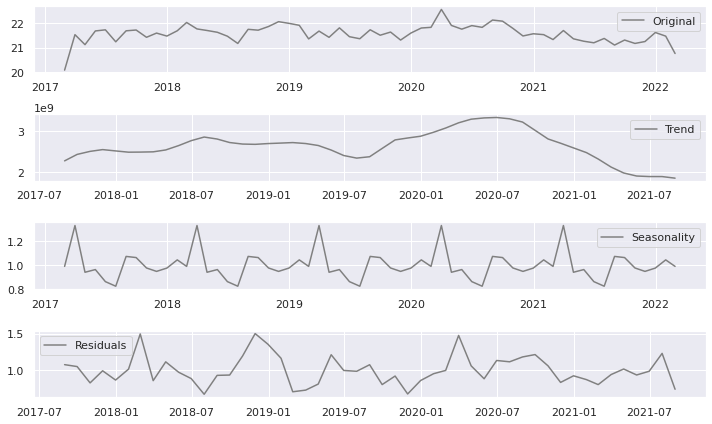
There are many types of time series based on data: additive, multiplicative, other temporal structures. Before time series forecast we must identify data types and remove seasonality, prepare stationarity. Time series decomposition is a technique that splits a time series into several components, each representing an underlying pattern category, trend, seasonality, and noise. Classical regressions such as Arima, etc. will provide the basic overview and deep learning algorithms will present more sophisticated approach. The file for time decomposition is providing daily shares volumes for Apple company.
Time Series Forecast Steps:
1. Identification of time series type
2. Seasonality tests
3. Stationarity tests
4. Decomposition
5. Regression
6. Deep learning
4. Decomposition
pip install pandas-datareader
import pandas_datareader.data as web
import datetime
import pandas as pd
pd.set_option('display.max_columns', None)
pd.set_option('display.max_rows', None)
import datetime
pip install seaborn
import seaborn as sns
sns.set()
pip install statsmodels
# remove time series trend
import pandas as pd
import numpy as np
import matplotlib.pyplot as plt
%matplotlib inline
apple_volume = pd.read_csv("Apple.csv", index_col=0, parse_dates=True)
apple_volume.head()
# Select only particular columns of my interest
# apple_volume = pd.DataFrame(apple_volume, columns = ['Date', 'Volume'])
apple_volume=apple_volume.groupby(['Date'])['Volume'].sum().reset_index()
apple_volume.head()
apple_volume.index = pd.to_datetime(apple_volume['Date'], format='%Y-%m-%d')
del apple_volume['Date']
apple_volume.groupby(by=[apple_volume.index.month, apple_volume.index.year])
# or
apple_volume.groupby(pd.Grouper(freq='M')) # update for v0.21+
apple_volume.head()
# applying the groupby function on df
apple_volume= apple_volume.groupby(pd.Grouper(axis=0,freq='M')).sum()
apple_volume.plot(figsize=(8,4), color="tab:grey");
apple_volume.dtypes
apple_volume["2021"].plot(kind="bar", color="tab:grey", legend=False);
from statsmodels.tsa.seasonal import seasonal_decompose
decompose_result = seasonal_decompose(apple_volume, model="multiplicative")
trend = decompose_result.trend
seasonal = decompose_result.seasonal
residual = decompose_result.resid
# decompose_result.plot();
plt.figure(figsize=(10,6))
plt.subplot(411)
plt.plot(np.log(apple_volume), label='Original', color="Grey")
plt.legend(loc='best')
plt.subplot(412)
plt.plot(trend, label='Trend', color="Grey")
plt.legend(loc='best')
plt.subplot(413)
plt.plot(seasonal,label='Seasonality', color="Grey")
plt.legend(loc='best')
plt.subplot(414)
plt.plot(residual, label='Residuals', color="Grey")
plt.legend(loc='best')
plt.tight_layout()

apple_volume.rolling(window = 12).mean().plot(figsize=(8,2), color="tab:grey", title="Rolling Mean over 12 month period");
apple_volume.rolling(window = 20).mean().plot(figsize=(8,2), color="tab:grey", title="Rolling mean over 20 month period");
apple_volume.rolling(window = 12).var().plot(figsize=(8,2), color="tab:grey", title="Rolling Variance over 12 month period");
apple_volume.rolling(window = 20).var().plot(figsize=(8,2), color="tab:grey", title="Rolling variance over 20 month period");
from statsmodels.graphics.tsaplots import plot_acf
plot_acf(apple_volume, title=None, color="Grey", vlines_kwargs={"colors": "Grey"});
#change the color of the vlines
plot_acf(apple_volume, lags=40, color="Grey", vlines_kwargs={"colors": "Grey"})
plt.show()
Comentários